I like to monitor the status of everything that is important: electricity and water consumption, heating and cooling, weather, server status, and more. To do this, you need a small server running monitoring software that periodically checks various services and sensors, stores the collected data in a database, and provides a visualization tool to display the information as charts, gauges, tables, and other widgets.
After testing a few popular solutions, I decided to use Checkmk, a free and open-source monitoring platform. It can monitor practically anything, and you can easily write scripts to collect data from custom sources. Of course, monitoring is not the only thing it can do. It can also alert you when a service fails (for example, when a server becomes inaccessible) or when a monitored value exceeds predefined limits.
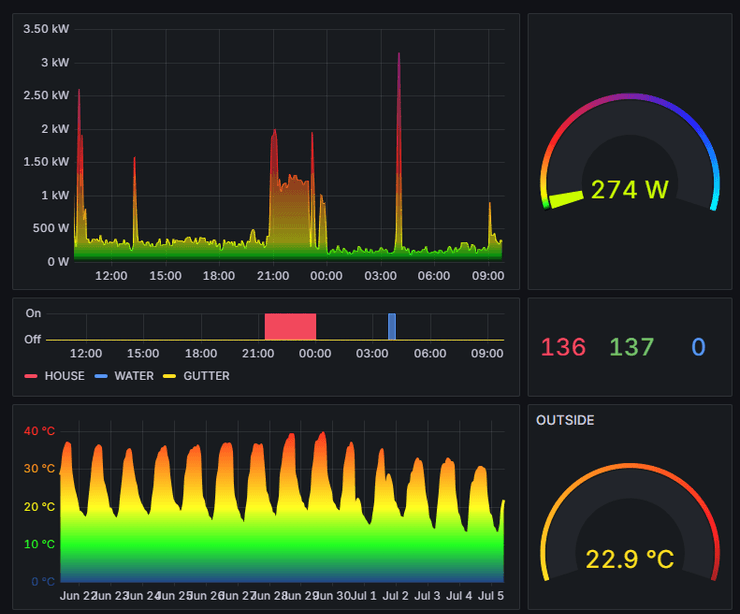
Although Checkmk includes its own visualization tools, I wanted something more flexible and customizable. I chose Grafana because it was exactly what I was looking for. It supports virtually every type of data source and a wide range of visualizations. Everything is highly configurable, and dashboards, panels, and charts can be easily exported and shared.
Of course, I also monitor digital broadcasting 🙂